These colorful new maps reveal the hidden diversity of life in Peruâs Andean and Amazonian forests
Not all forests are created equal.
The massive green swaths of Peruâs Andean and Amazonian forests host a more diverse array of life than previously thought â much of which has been hidden beyond the visible spectrum of light until now.
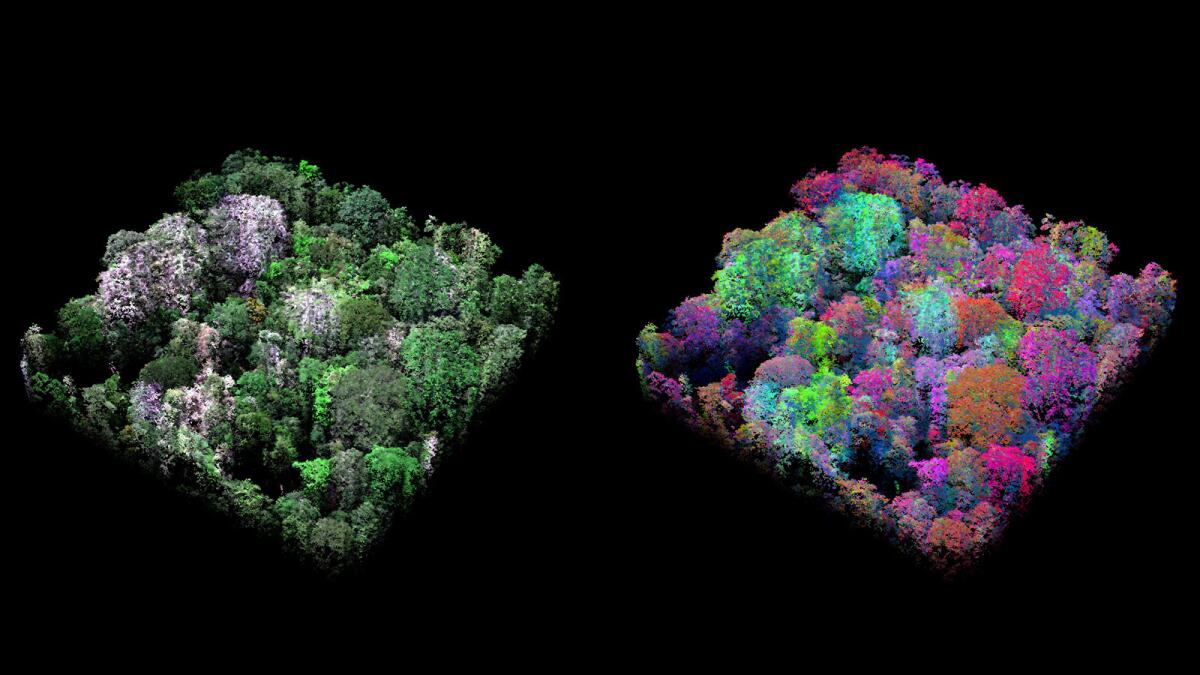
Stanford University scientists have created colorful new maps that show the forest in its full spectral glory. The psychedelic imagery represents each tree species according to its unique chemical signature, creating a kind of tie-dye effect across the landscape that reveals biologically distinct zones in the forest. Before now, these areas may have gone unnoticed â and in many cases, unprotected.
âThis changes the name of the game for conservation in the region,â said Greg Asner, an ecologist at the Carnegie Institution for Science at Stanford.
Threats to the regionâs forests include oil exploration, ranching and logging, as well as cases of illegal gold mining and a growing demand for palm oil plantations. In one area, deforestation rates have increased by 500% since 2010.
The problem has been that scientists and the Peruvian government didnât know what they were losing when forestland was converted to a ranch or a mine, Asner said. The flip side is that officials didnât know exactly what they were protecting when they designated national parks either.
âIf you look at any current satellite data ⌠it only deciphers whether there is a forest present or not, not anything about the forest,â Asner said.
The maps, developed with help from the Peruvian government, tell a more complete story of the forest, Asner said. That makes conservation less of a guessing game and more of a tactical one.
âWe canât just do forest conservation based on forest cover, because itâs blind,â he said. âWe have to know the kinds of forests that are out there.â
To create the maps, Asner and colleagues first had to âcrack the biological codeâ of the Amazonian and Andean trees â a daunting task, he said. Peru has more than 180 million acres of forest cover, ranging from hot Amazonian lowlands to the higher, cooler Andean treelines.
In 2013, the team took to the skies in a specialized plane to scan the chemical composition of the forest foliage using the Carnegie Airborne Observatoryâs battery of laser-guided sensors. Asner and colleagues used the same technique to map the effects of drought on the California forest last year.
The team measured 20 different components found in the treesâ foliage, including nitrogen, water and minerals. Depending on their habitat, plants absorb different nutrients from the surrounding soil, a diet that ends up reflected in their leaves.
From those 20 components, they learned seven were key to identifying the species of a tree, much like spelling out the letters of a name.
âThese seven chemicals help us decipher who is out there,â Asner said. âAfter that, we can pile them into communities of species.â
The chemical signatures revealed that Peruâs forests consist of 36 distinct communities, each with a distinct assemblage of species and its own ecological function. Scientists previously thought there were only three types of forest communities in the region.
The team verified their results by exploring Peru on foot â just like the naturalist Alexander von Humboldt did in 1801 â to confirm the forest types were indeed new to science.
To determine the areas most in need of protection, Asner overlaid the psychedelic imagery with the Peruvian governmentâs maps of deforestation and protected areas.
The combined data reveal that five communities near the base of the Andes were subject to deforestation rates of up to 17,000 acres per year.
In addition, the study found that 16 million acres of forest are particularly underrepresented in the countryâs network of national parks.
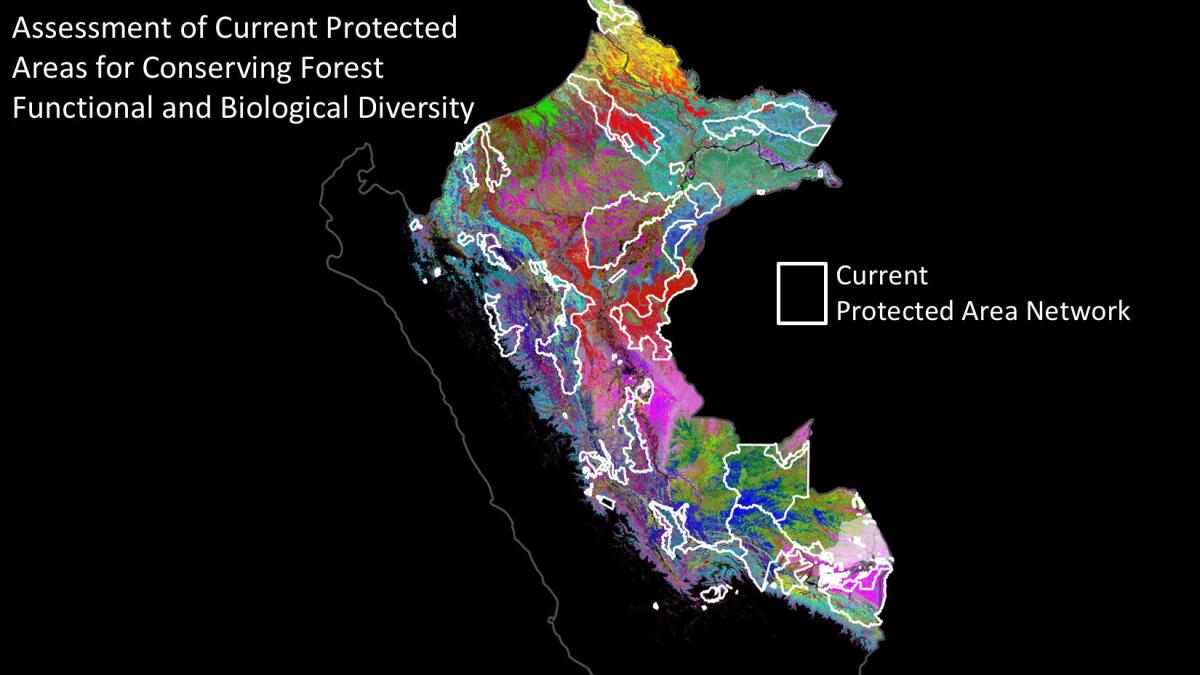
The 36 different forest types are shown through the Andes and Amazonian regions of Peru. Current protected areas are outlined in white.
International biodiversity targets emphasize the need to represent all ecosystems in the worldâs protected areas, but identifying them has been a challenge. Tropical rainforests such as the Peruvian Amazon are notoriously difficult to study from the ground, and many species there are poorly understood or unknown to science, Valerie Kapos, who heads the United Nations Environment Programâs climate change and biodiversity work, wrote in an article accompanying the Science study.
Applying Asnerâs techniques to forests worldwide has âtantalizingâ potential to aid efforts to find and protect biodiversity hot spots, Kapos wrote.
Asner and his flying lab have mapped forests in California, Hawaii, Borneo and Ecuador. He admits he canât cover the whole world by plane â but he can with a satellite.
âWe need to go global,â he said.
If he can put his imaging technique into orbit, Asner said, he can make a fresh map of biodiversity on Earth every month. Working with longtime partners at NASAâs Jet Propulsion Laboratory in La CaĂąada Flintridge, Asner said he is exploring partnerships with public agencies and private organizations to meet the estimated $200-million price tag. The satellite could be ready in two to three years.
âWe can find out what weâve got protected now and what we donât, and over time we can find out what weâre losing and whatâs changing,â Asner said. âI canât fly the plane everywhere. The only way to do it is to get it in orbit.â
MORE IN SCIENCE
Itâs possible to âvaccinateâ Americans against fake news, experiment shows
Grocery store tomatoes taste like cardboard â Florida researchers are fixing that
Fossil hunters discover an ancient iguana that lived in a dinosaur nesting site in Montana

